Monitor My Maple is our flagship citizen science project.
Residents volunteer to observe and record seasonal changes (also called phenological changes) in local maple trees.
Here in the North Country, we benefit from maples in a variety of ways: they provide critical wildlife habitat, high-quality timber, gorgeous fall color displays, and, of course, the maple syrup we pour over our pancakes. However, recent research indicates that maple growth is declining in our region, and there is concern among scientists about how a warming and increasingly unpredictable climate will affect both maple health and maple syrup production. Through the Monitor My Maple Project, you can help contribute to our knowledge of how climate, habitat, and human activities are affecting these cherished local species.
Why Monitor Maples?
By creating a network of people observing and recording the dates of seasonal changes in sugar maples, we can learn a wealth of information about tree health across the North Country. This will help us plan to preserve maple trees and the traditions that surround them. Check out our Monitor My Maple tutorial video below.
How to Participate:
Monitoring maples is easy, and it’s a great way to get outdoors and observe the environment more closely. First, pick a maple (preferably a sugar maple) in your yard, near your workplace, or in a park you visit frequently. Then, create a free user account on natureupnorth.org so that you can share your maple observations online. The Monitor My Maple project is accessed by clicking the “Citizen Science” menu on our home page.
During the spring and fall, observe your maple tree regularly. In the spring, record the dates when maple buds break and when their leaves fully form. In the fall, collect and record data on when leaves begin to change color and drop off the tree. Record this information on either the Spring or Fall Maple Monitoring data page, depending on the season. The more observations you can record, the better, and we encourage you to enter data even if your tree hasn't changed since the last time you entered data. To date, local residents have contributed more than 2,400 maple observations on natureupnorth.org.

What You’ll Need:
Maple monitoring requires a couple of simple household items. You will need:
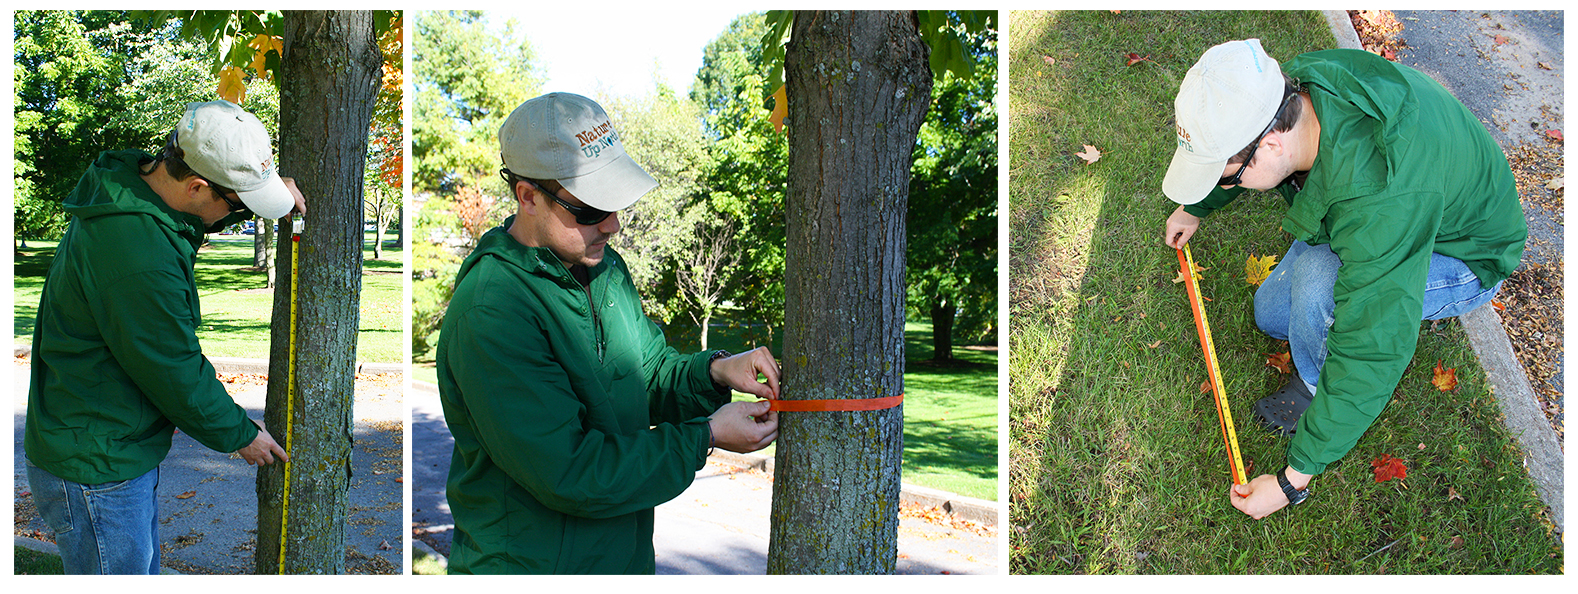
- A tape measure or cloth measuring tape to measure the circumference of your tree
- A string (if you are using a metal tape measure)
- A paper data sheet (download available at bottom of this page) or smartphone
- An internet connection (to log observations on natureupnorth.org)
- A keen eye
Ready to go?
To get started, follow these steps:
1. Create an account. Please create a free user account on www.natureupnorth.org by clicking the yellow box in the right-hand corner of your screen.
2. Sign up for Monitor My Maple. Next, sign up for the Monitor My Maple project using this registration form.
3. Add Your Tree(s). Visit our Maple Data Portal to create a new tree or add data to existing trees. Remember, you must be logged in and registered to view the portal and add data.
4. Print datasheets. We recommend printing data sheets to bring you when visiting your tree.
5. Continue monitoring through the season! In the fall, please monitor your tree until all leaves have dropped. In the spring, stop monitoring your tree after leaf out.

Identifying Sugar Maples:
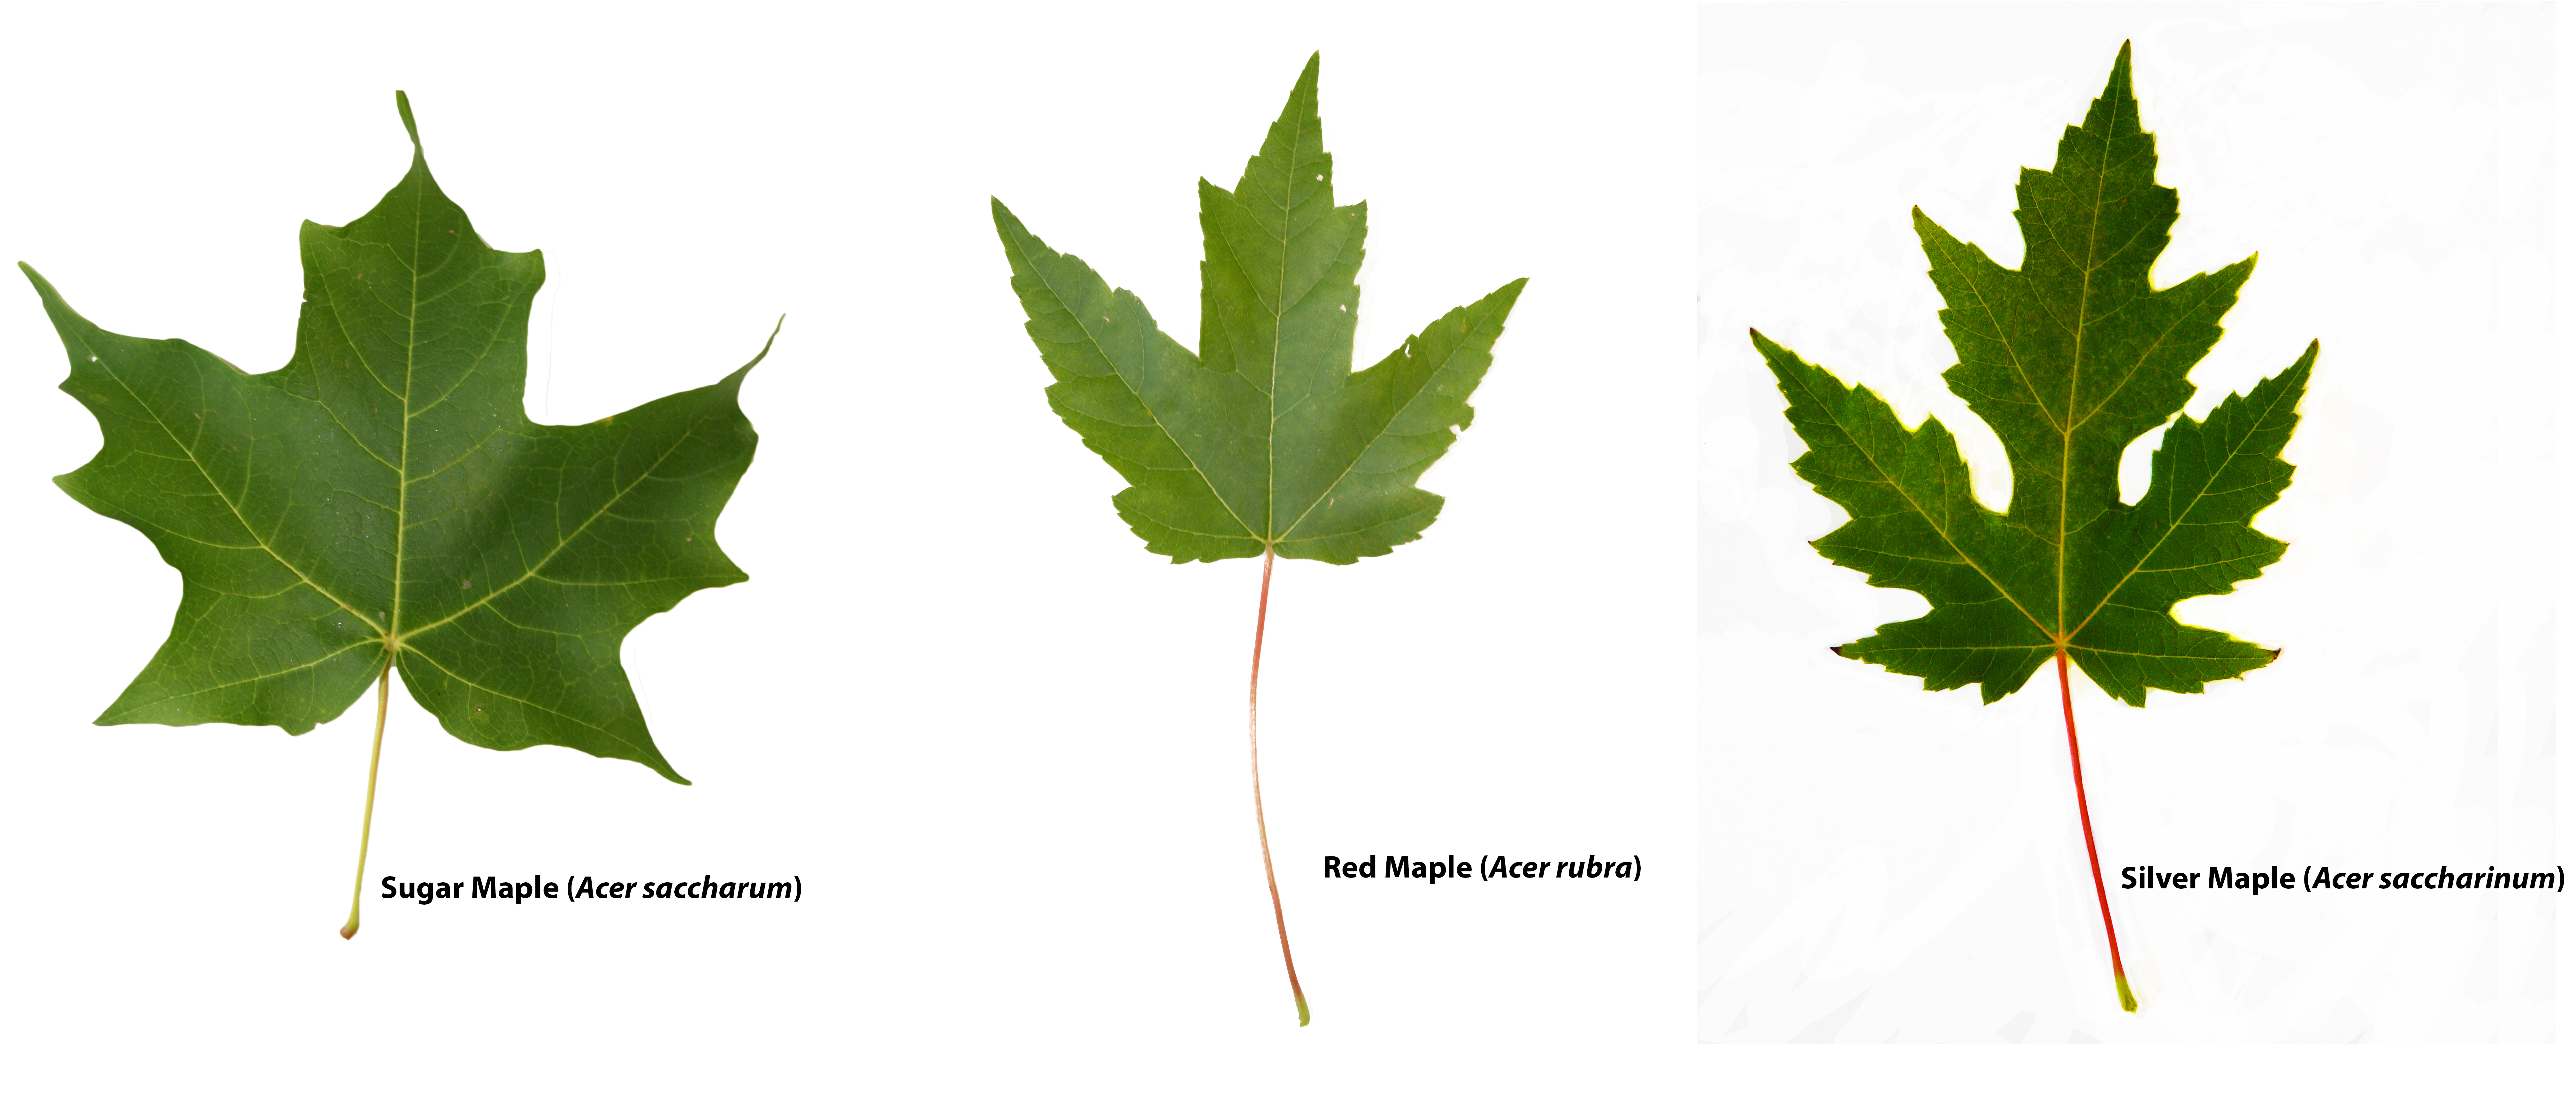
There are five species of maple native to St. Lawrence County - sugar, silver, red, striped, and boxelder. Several other species have been introduced, including Norway and Japanese maples. For this project, we are particularly interested in sugar maples. However, if you cannot find a sugar maple near you, we accept data from red, silver, and Norway maples too. During Fall Monitor My Maple you'll be able to identify your tree by its leaves.
The sugar maple leaf has smooth edges, five major points (lobes) and U-shape spaces between the lobes, called sinuses. The sugar maple leaf is represented on the Canadian flag. In contrast, red maple leaves have a jagged leaf edge, three or five lobes, and V-shaped sinuses. Norway maple leaves are similar to sugar maple, but are often wider, darker, and produce a white, milky sap at the base of the leaf stem when pulled off the tree. See the image above for comparison.

Identifying sugar maple trees is harder in the winter and early spring when you only have buds and bark for comparison. Sugar maple buds are brown, slender, and pointed at the tips. The terminal bud (last one on the branch tip) will usually be in a three-pronged arrangement. Red maple buds are red in color, and blunter and more rounded than sugar maple buds. They tend to grow in clusters. Silver maple buds look similar to red maple, but if you scratch the bark and take a whiff, you may notice an unpleasant odor. See above for examples of maple buds. Note that, depending on the time of year and the position on the tree, buds may appear to be more or less swollen.
Questions:
Have questions or need help getting started? Please contact our team by emailing us at info@natureupnorth.org and including "Monitor My Maple" in the subject line.
Use the Data:
We make Monitor My Maple data accessible to the public for use by educators, researchers, and natural resource managers. At present, we have three data products and one data visualization tool available.
At the bottom of this page you can download:
- The entire excel spreadsheet and/or the entire .csv file.
- The excel spreadsheet and/or the .csv file for the fall data from 2014 through fall 2017.
- The excel spreadsheet and/or the .csv file for the spring data from 2014 through 2017.
All of this is also available here as a google sheet with three tabs.
To use the data visualization portal, which allows you to manipulate histograms of tree circumference as a function of different environmental variables, click here.
